• Welcome to TechPowerUp Forums, Guest! Please check out our forum guidelines for info related to our community.

LogViewer for GPU-Z available !

Joined
Jun 7, 2013
Messages
39 (0.01/day)
Location
Switzerland
LogViewer for GPU-Z is available !

Introduction

I like the tool GPU-Z, especially the logging functionality! It's the only tool I know which logs VRM temperatures reliable. But analyzing the logs can be tricky. Of course, you can open a log-file in Excel, but then you have to do a lot of steps until you get an useful diagram (and not everybody has an Excel license).

So ... I decided to implement a simple tool which shows diagrams of log files after "a few clicks" !
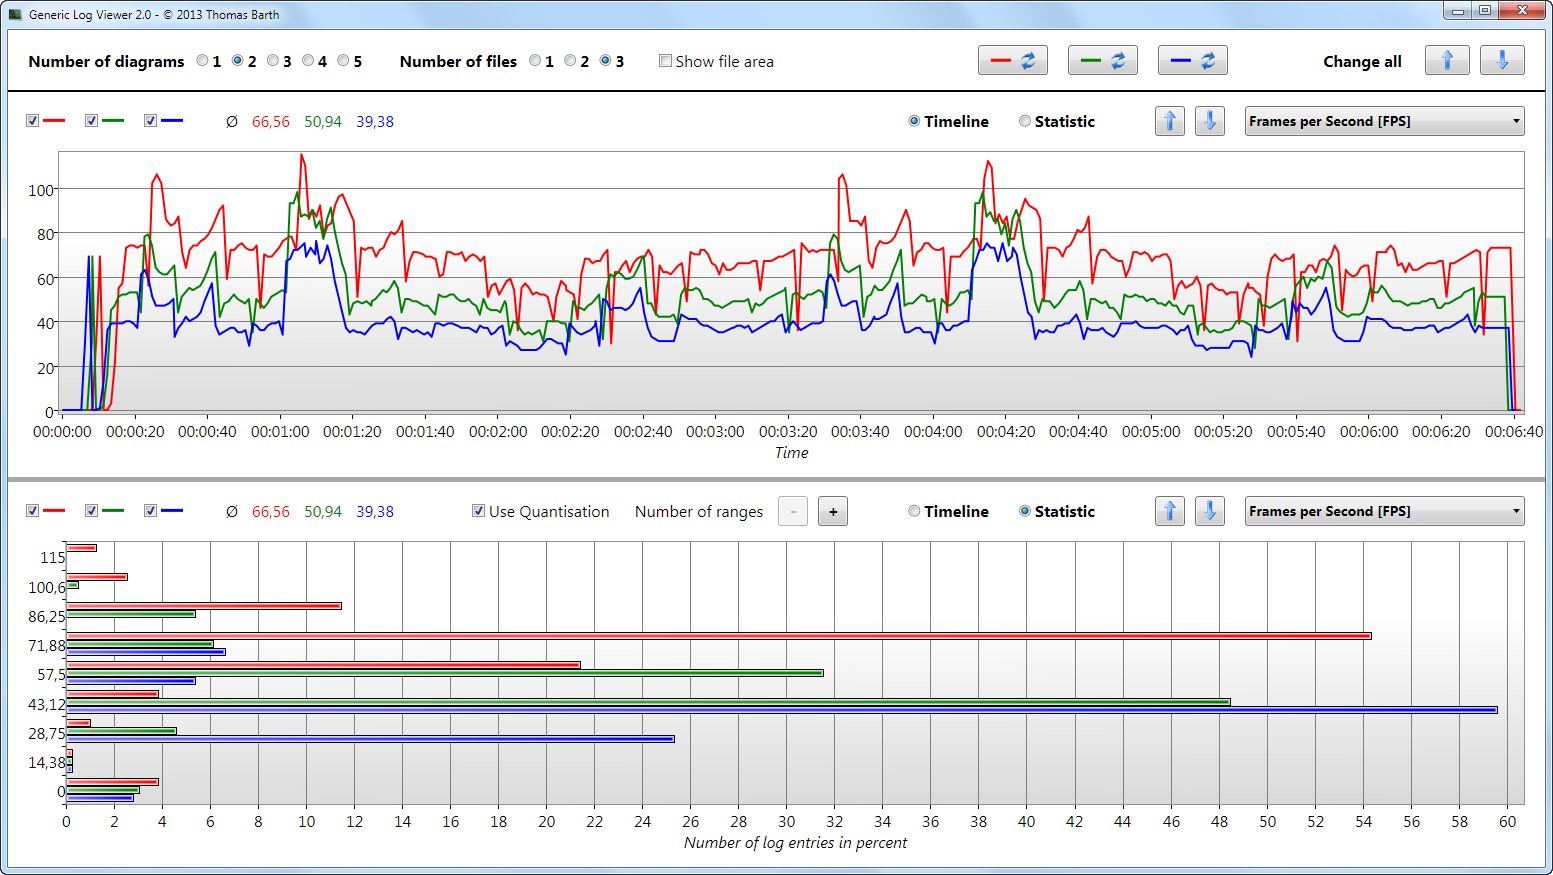
  • it allows to illustrate GPU-Z log data in several diagrams and
  • to compare multiple log-files side-by-side in one diagram !
ValleyBenchmark.png


User Guide (on YouTube)

The tool is very simple to use: no installation necessary, just start "GenericLogViewer.exe". At the top you can select
  • how many diagrams with
  • how many log-files
should be presented by the tool.

Open an GPU-Z log file by clicking the "Open File" button, select application type "GPU-Z", select a GPU-Z log file and press "Open" (GPU-Z log-files have typically the filename pattern: *.txt). After parsing the file, the logging duration of the file is shown and by default the "Timeline" diagram of the first log category. You can change the shown diagram with:
  • Timeline/Statistic RadioButton
  • Log Category ComboBox
  • Change all buttons (changes category in every diagram)
The Y-axis shows the values of the seleted Log Category in ComboBox (unit is within [..])

If an opened file is still updated with logging-data by GPU-Z, you can simple update/refresh it by clicking on the "Reload"-Button:

Reload.png

At the top left corner of every diagram you can find the arithmetic average of the corresponding curve:

Average.png

If there are too many different values on Y-axis in "Statistic" mode, the values are grouped into ranges. If this is the case, the following control is shown, which allows to increase or decrease the number of ranges (or to disable quantisation).

Quantisation.png

Splitter between the diagrams allow you to adjust the height of all diagrams:

Splitter.png


After opening all log files you can hide the file area by unmarking "Show file area" to get more space for diagrams.

New feature since version 2.1: Simple Mode
I added a "two columns" feature, which doubles the number of diagrams. But if you use "two columns" with a high "number of diagrams" the diagrams are very small. That's why I introduced the "Simple mode" which:
  • simplifies header and footer
  • decrease line thickness
Tip: use the "Tab"-key to toggle between 'Standard' and 'Simple' mode !

New feature since version 3.0: Time Window Definition
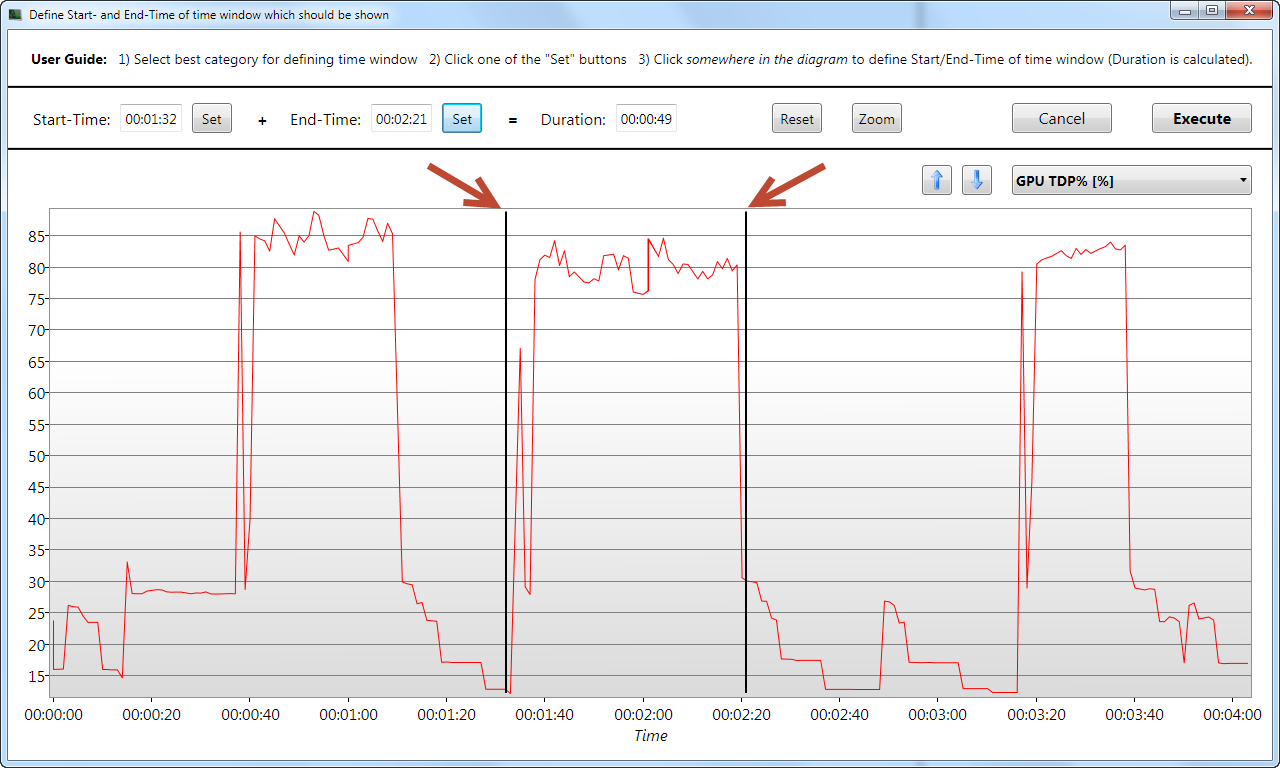
If you click the "Edit"-button in the file area, a new window will be opened to define Start- and End-time of a time window for the logfile (see user guide at the top of this window). It allows you
  • to show only a part of a single logfile or
  • to synchronize multiple logfiles
Attention: time window start-time is "normalized" to "00:00:00", otherwise synchronization of multiple log-files will not work !

Button description:
  • "Set": defines Start/End time of time window
  • "Reset": resets Start/End time to "file borders"
  • "Zoom": zooms into diagram with the actual defined Start/End times for fine-tuning (from Start-10% to End+10%). Remark: works only in case of Start/End is more then 10% from "file Start/End times")
  • "Cancel": closes window without any change
  • "Execute": yes, take the actual defined Start/End times as the used time window for all diagrams !
TimeWindow.png


New features since version 4.0 (August 2018):
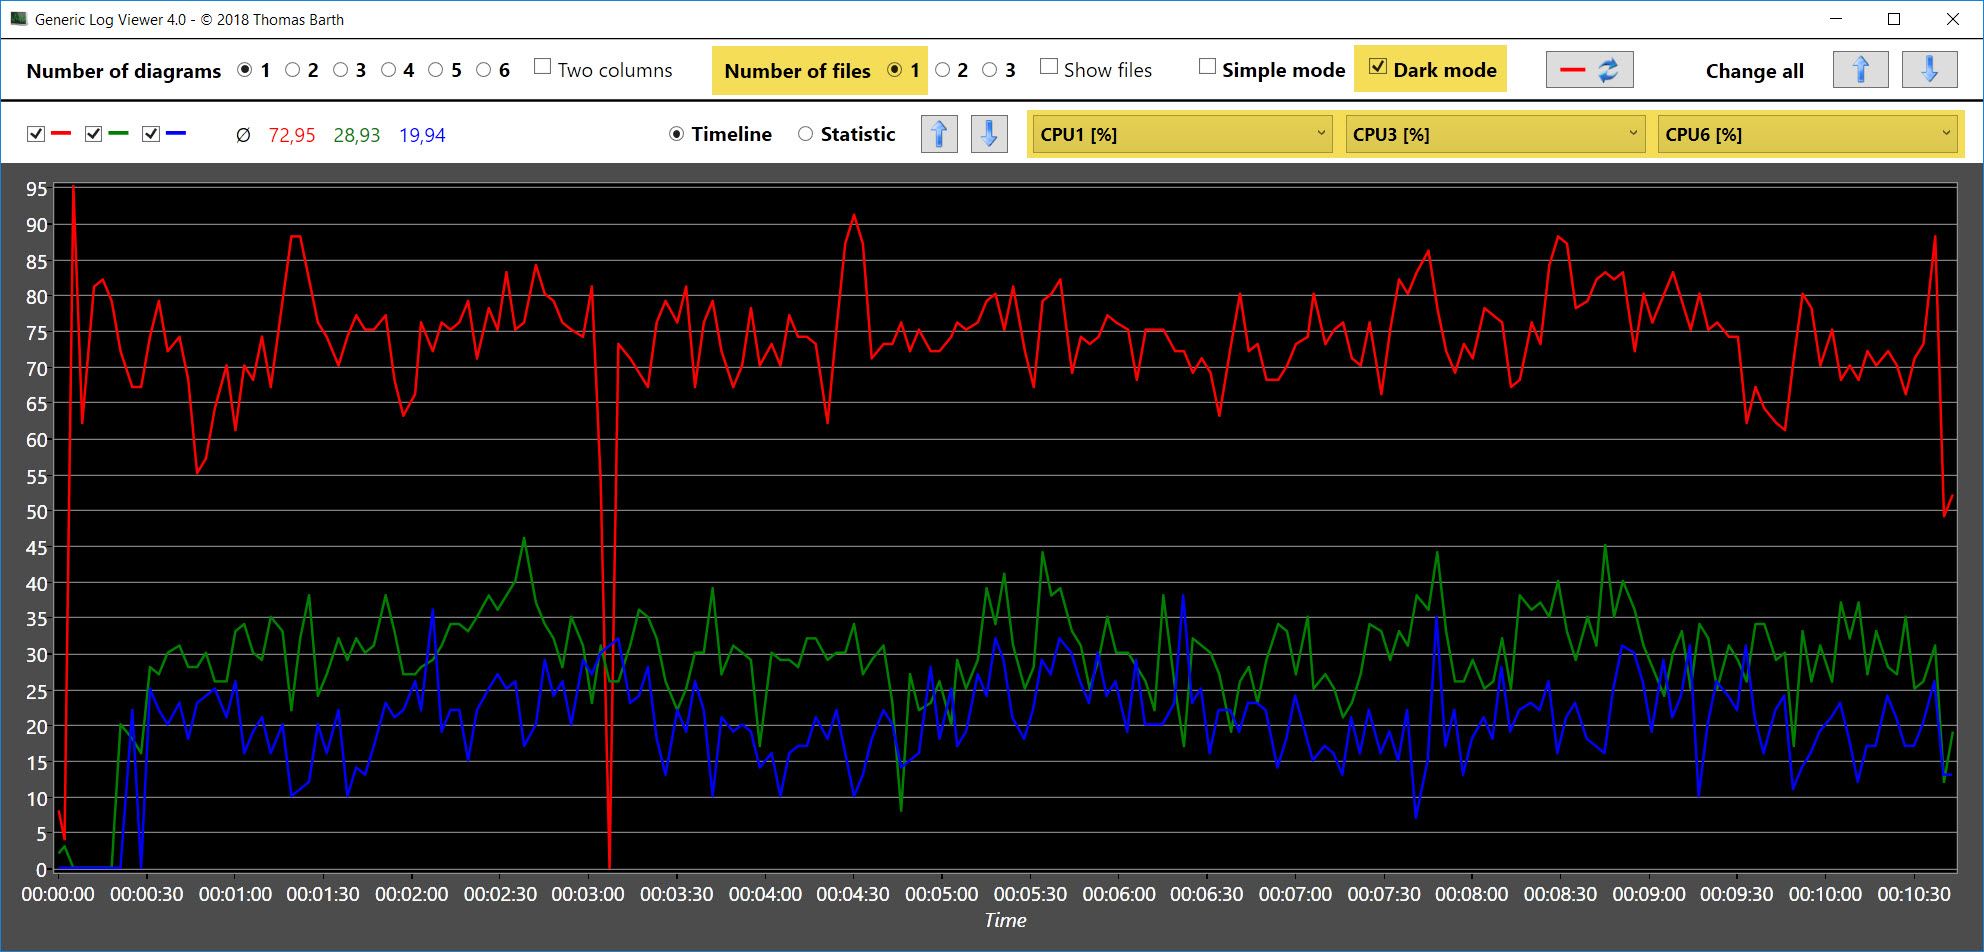
  • possibility to compare different categories of one file in one diagram
  • possibility to present diagrams in a "dark style"
GenericLogViewer_4.0.jpg


New features since version 5.0 (July 2019):
  • MSI Afterburner Logs are now supported too (*.hml)
  • "Statistic"-diagram got many improvements (now it works as it should)
  • New diagram-type "Triple" implemented , which shows Minimum, Average and Maximum in a barchart
Triple-Diagram.jpg


New features since version 5.2 (November 2019):
  • Ability to load/save setups of LogViewer (see Post #30 for details)
  • Save Screenshot functionality

New features since version 5.4 (October 2020):
  • "Reload file" button can be configured to display only the "last x minutes" (see Post #46 for details)

New features since version 6.0 (May 2021):
  • Command Line Arguments
  • Drag & drop of files
  • "Change all" buttons with SMART-functionality
  • For details check this video on YouTube

New features since version 6.1 (July 2021):
  • Style your own Generic Log Viewer MainWindow ... if you like
  • Diagrams can now be "locked" (for "Change all" buttons with SMART-functionality)
  • Some new "Hot-Keys" are implemented
  • For details check Post #49

New features since version 6.2 (November 2021):
  • Selection of log-application via command-line-argument
  • Optional file "GenericLogViewer.cla" for better "Open with ..."
  • Adjustment of hot keys
  • For details check Post #50

New features since version 6.3 (April 2022):
  • "Selfie-Mode" for better screenshots
  • Category ComboBoxes have now color-markers on the left side
  • Screenshot functionality improved
  • For details check Post #57

New features since version 6.4 (Mai 2022):
  • "Marker-Mode", which allows precise determination of every single log value
  • For details check Post #58

Requirements
  • Microsoft Windows
  • Microsoft Framework .NET 4.8 (Windows Update from April 2019)
  • no installation necessary, just start "GenericLogViewer.exe"

Download Version 6.4
SHA-1 hash: 2F19F0ABC093E495617B15663E1537D436643934
 

Attachments

  • GenericLogViewer_v6.4.zip
    601.1 KB · Views: 4,552
Last edited:
Joined
Apr 13, 2009
Messages
230 (0.04/day)
System Name NERV
Processor AMD Ryzen 5 2600X
Motherboard ASROCK B450M Steel Legend
Cooling Artic Freezer 33 One + 2x Akasa 140mm
Memory 2x8 Crucial Ballistix Sport 2993 MHz
Video Card(s) KFA2 GeForce RTX 3060 Ti
Storage Crucial Mx500 500GB + 1TB HDD
Display(s) Samsung C34H892
Case CM Masterbox Q300L
Audio Device(s) ALC892 + Topping D30
Power Supply Corsair RM650
Mouse CM Mastermouse Lite S
Keyboard Logitech G510
Software Win 10 Pro x64
Benchmark Scores No bech, only game!
Wow, could be awesome if Wizz fits your utility in gpu-z (or you could team-up with Wizz and make gpu-z even better!)
 
Joined
Jun 7, 2013
Messages
39 (0.01/day)
Location
Switzerland
New version available !

I just want to inform, that there is a now much better version of my LogViewer available:

It´s now possible to compare multiple log files side-by-side in one diagram !

Please try my new "GenericLogViewer" ... download above ...
 
Joined
Jun 7, 2013
Messages
39 (0.01/day)
Location
Switzerland
New Version 1.3 available !

It fixes DateTime conversion problems, which could occur on several Windows Region Settings.

Please update to latest version !
 
Joined
Jun 7, 2013
Messages
39 (0.01/day)
Location
Switzerland
New Version 2.0 available !

New features:

  • Reload-Button: to refresh active logging-files
  • arithmetic averages of all curves are shown
  • quantisation can be disabled if wanted
Why new major version 2?
I did a lot of internal changes and code is now completly verified by Unit-Tests.

Please update to latest version !
 
Joined
Aug 17, 2009
Messages
1,585 (0.28/day)
Location
Los Angeles/Orange County CA
System Name Vulcan
Processor i6 6600K
Motherboard GIGABYTE Z170X UD3
Cooling Thermaltake Frio Silent 14
Memory 16GB Corsair Vengeance LPX 16GB (2 x 8GB)
Video Card(s) ASUS Strix GTX 970
Storage Mushkin Enhanced Reactor 1TB SSD
Display(s) QNIX 27 Inch 1440p
Case Fractal Design Define S
Audio Device(s) On Board
Power Supply Cooler Master V750
Software Win 10 64-bit
Just found this. Thanks very much. Will try it out later.
 
Joined
Jun 7, 2013
Messages
39 (0.01/day)
Location
Switzerland
New Version 2.1 available !

New features:
  • up to 6 diagrams
  • in up to 2 columns (-> max = 12 diagrams)
  • "Simple mode" (for small diagrams)
  • Tooltip with horizontal line
I added a "two columns" feature, which doubles the number of diagrams. But if you use "two columns" with a high "number of diagrams" the diagrams are very small. That's why I introduced the "Simple mode" which:
  • simplifies header and footer
  • decrease line thickness
Tip: use the "Tab"-key to toggle between 'Standard' and 'Simple' mode !

Another new feature is that you can create a horizontal line in a "Timeline" diagram:
go with mouse "on curve where the horizontal line should be", wait until tooltip pops up (with value) and click -> line stays there until you click on another tooltip or you change category.

Hope you enjoy my new features ... Tom

Download: see first post of this thread !
 
Joined
Feb 24, 2009
Messages
3,516 (0.61/day)
System Name Money Hole
Processor Core i7 970
Motherboard Asus P6T6 WS Revolution
Cooling Noctua UH-D14
Memory 2133Mhz 12GB (3x4GB) Mushkin 998991
Video Card(s) Sapphire Tri-X OC R9 290X
Storage Samsung 1TB 850 Evo
Display(s) 3x Acer KG240A 144hz
Case CM HAF 932
Audio Device(s) ADI (onboard)
Power Supply Enermax Revolution 85+ 1050w
Mouse Logitech G602
Keyboard Logitech G710+
Software Windows 10 Professional x64
Why have I not seen this until now? This is something that I've wished for so long after looking at my first GPU-z log.

Will try out once I get home this evening.
 
Joined
Jun 7, 2013
Messages
39 (0.01/day)
Location
Switzerland
New Version 3.0 available !

New feature: time window definition per logfile possible:
  • to show only a part of a single logfile or
  • to synchronize multiple logfiles
See detailed description in first post of this thread ...

Download: see first post of this thread !
 
Joined
Aug 13, 2009
Messages
3,254 (0.58/day)
Location
Czech republic
Processor Ryzen 5800X
Motherboard Asus TUF-Gaming B550-Plus
Cooling Noctua NH-U14S
Memory 32GB G.Skill Trident Z Neo F4-3600C16D-32GTZNC
Video Card(s) AMD Radeon RX 6600
Storage HP EX950 512GB + Samsung 970 PRO 1TB
Display(s) HP Z Display Z24i G2
Case Fractal Design Define R6 Black
Audio Device(s) Creative Sound Blaster AE-5
Power Supply Seasonic PRIME Ultra 650W Gold
Mouse Roccat Kone AIMO Remastered
Software Windows 10 x64
Oh wow, how did I miss this?
 
Joined
Jan 5, 2012
Messages
109 (0.02/day)
Very useful tool. Is it possible to make Nvidia Inspector log files compatible?
 
Joined
Jun 7, 2013
Messages
39 (0.01/day)
Location
Switzerland
I tried Nvidia Inspector (which is very close to GPU-Z), but it logs with a different column delimiter. With the following steps you can "convert" a Nvidia Inspector logfile into a GPU-Z logfile:

  • open Nvidia Inspector logfile (typically "NVIDIA_Inspector-MonitoringLog_....csv") in a good text-editor (UltraEdit ,...)
  • find/replace column delimiter: find all semicolon ';' and replace them with comma ',' (in a good text editor you can do this in one step "replace all")
  • save changed logfile with extension ".txt"
Now you can open the saved logfile as a "GPU-Z logfile" !
 
Joined
Jun 7, 2013
Messages
39 (0.01/day)
Location
Switzerland
New version 4.0 available !

Hi all, I spent some time to improve the GenericLogViewer, so Version 4.0 has two new features:
  • possibility to compare different categories of one file in one diagram
  • possibility to present diagrams in a "dark style"

1) Multiple categories of one file in one diagram
If you have only one file loaded, you can find a new "+" button on the right side of the category ComboBox in every diagram:

AddButton.jpg

This button allows you to add up to two more category ComboBoxes. Attention: be aware of comparing same units (within [..]). Comparing CPU [MHz] with CPU [%] doesn't make sense ... . You can reset the "number of category ComboBoxes" to one with the follwing trick:
  1. Select "number of files" = 2
  2. Select "number of files" = 1

2) Diagrams in a dark style
Together with YouTuber F2F Tech I developed a "dark style" for the diagram section. In the header of GenericLogViewer you can find a CheckBox "Dark mode" which enables/disables the dark style in the diagrams. Why not a complete dark style like "Metro Style"? I personally like the contrast between the control and diagram sections.

DarkMode.jpg


... two more things:
  • Upgrade from Visual Studio 2010 -> 2017
  • Upgrade from .NET 4.0 -> 4.6.1 (released November 2015)

Download
The zip file (SHA-1 hash, Version 4.0: E47BE177E0DC896BEF6E0312A085DE2F0A95B3A1) contains the binary files of the tool.

Hope you enjoy the new features ... Tom
 

Attachments

  • GenericLogViewer - Version 4.0.zip
    447.1 KB · Views: 467
Joined
Apr 18, 2012
Messages
390 (0.08/day)
Processor AMD Ryzen 9 5900X
Motherboard Gigabyte B550 Aorus Pro
Cooling Wraith Prism
Memory Crucial Ballistix 3600Mhz 16GB (4x8GB)
Video Card(s) -
Storage Samsung 850 Evo, 860 Evo, 980 and Crucial MX500
Display(s) Samsung Neo G9 Odyssey
Case Corsair 7000D
Power Supply -
VR HMD Quest 2
Really nice utility, hope it gets advertised as a side link to GPU-Z, high and lows reporting would be nice too

make is just like afterburners logging window :D
 
Joined
Mar 15, 2013
Messages
3,682 (0.85/day)
Location
GMT +2
System Name Red Radiance l under construction
Processor 5800x
Motherboard x470 taichi
Cooling stock wrath
Memory TridentZ Neo rgb 3600mhz (2x8 kit)
Video Card(s) Sapphire Vega 64 nitro+
Storage 970 evo nvme
Display(s) lc27g75tq
Case tt core x5 tge
Audio Device(s) sennheiser's pc323d usb soundcard
Power Supply corsair AX860i
Mouse roccat burst pro
Keyboard roccat ryos mk fx
Software windows 10
Joined
Jun 7, 2013
Messages
39 (0.01/day)
Location
Switzerland
New version 4.2 available !

Hi all, I built a version 4.2 with the following new features:
  • category names are sorted alphabetically
  • as requested by @Absolution, Minimum and Maximum values are now also displayed

MinMax.jpg


Download
The zip file (SHA-1 hash, Version 4.2: A590912FA8A183D2AA2BBEA563C6EB2A795AE3F4) contains the binary files of the tool.
 

Attachments

  • GenericLogViewer - Version 4.2.zip
    448.7 KB · Views: 422
Joined
Apr 18, 2012
Messages
390 (0.08/day)
Processor AMD Ryzen 9 5900X
Motherboard Gigabyte B550 Aorus Pro
Cooling Wraith Prism
Memory Crucial Ballistix 3600Mhz 16GB (4x8GB)
Video Card(s) -
Storage Samsung 850 Evo, 860 Evo, 980 and Crucial MX500
Display(s) Samsung Neo G9 Odyssey
Case Corsair 7000D
Power Supply -
VR HMD Quest 2
Cheers mate, will have a go at it when I go home
 
Joined
Jun 7, 2013
Messages
39 (0.01/day)
Location
Switzerland
New version 5.0 available !

Hi all, I built a version 5.0 with the following new features:
  • MSI Afterburner logs are now supported too (*.hml)
  • "Statistic"-diagram got many improvements (now it works as it should)
  • New diagram-type "Triple" implemented, which shows Minimum, Average and Maximum in a barchart:
Triple-Diagram.jpg


Attention:
"Generic Log Viewer" requires now at least .NET Version 4.7.2 (Windows Update from April 2018).

Download
The zip file (SHA-1 hash, Version 5.0: FF254733E3F515C76BA6F744050B51D4DA29BB6B) contains the binary files of the tool.
 

Attachments

  • GenericLogViewer - Version 5.0.zip
    491.2 KB · Views: 446
Last edited:

Solaris17

Super Dainty Moderator
Staff member
Joined
Aug 16, 2005
Messages
27,186 (3.84/day)
Location
Alabama
System Name RogueOne
Processor Xeon W9-3495x
Motherboard ASUS w790E Sage SE
Cooling SilverStone XE360-4677
Memory 128gb Gskill Zeta R5 DDR5 RDIMMs
Video Card(s) MSI SUPRIM Liquid X 4090
Storage 1x 2TB WD SN850X | 2x 8TB GAMMIX S70
Display(s) 49" Philips Evnia OLED (49M2C8900)
Case Thermaltake Core P3 Pro Snow
Audio Device(s) Moondrop S8's on schitt Gunnr
Power Supply Seasonic Prime TX-1600
Mouse Razer Viper mini signature edition (mercury white)
Keyboard Monsgeek M3 Lavender, Moondrop Luna lights
VR HMD Quest 3
Software Windows 11 Pro Workstation
Benchmark Scores I dont have time for that.
Could you add (or maybe im missing it?) a way to remove fields I have added? I add a measurement but sometimes I want t remove it to de-clutter and look more into a specific field.
 
Joined
Jun 7, 2013
Messages
39 (0.01/day)
Location
Switzerland
Hm ... I'm sorry, not really clear what you mean (?).

Can you explain it with more details, maybe with a screenshot and/or an example log-file ...
 

Solaris17

Super Dainty Moderator
Staff member
Joined
Aug 16, 2005
Messages
27,186 (3.84/day)
Location
Alabama
System Name RogueOne
Processor Xeon W9-3495x
Motherboard ASUS w790E Sage SE
Cooling SilverStone XE360-4677
Memory 128gb Gskill Zeta R5 DDR5 RDIMMs
Video Card(s) MSI SUPRIM Liquid X 4090
Storage 1x 2TB WD SN850X | 2x 8TB GAMMIX S70
Display(s) 49" Philips Evnia OLED (49M2C8900)
Case Thermaltake Core P3 Pro Snow
Audio Device(s) Moondrop S8's on schitt Gunnr
Power Supply Seasonic Prime TX-1600
Mouse Razer Viper mini signature edition (mercury white)
Keyboard Monsgeek M3 Lavender, Moondrop Luna lights
VR HMD Quest 3
Software Windows 11 Pro Workstation
Benchmark Scores I dont have time for that.
Hm ... I'm sorry, not really clear what you mean (?).

Can you explain it with more details, maybe with a screenshot and/or an example log-file ...

Sure. So basically the + sign that allows you to add statistics from your log file.

128099


The problem is sometimes I want to compare multiple statistics to look at trends in data. like vcore usage to temperature ramp up. So viewing multiple statistics side by side etc is great. However, if I want to then go back and say look at clockrate more granularly or simply focus on that statistic in general, while I can modify a drop down the other statistic that I "added" remains.

It just adds to the noise and imo makes it a bit hard to read for me. Especially if I add 4 or 5 statistics like vmem, vgpu, clockrate, cpu temp, gpu temp. I have alot of data going on at once but I may want to get rid of it to look at a different data set.

At this point I need to close and re-open the software to get a better view.

Like wise I can "uncheck" (via the left) to omit data in the graph, but the graph will not scale to properly show what I am viewing.

For example here is me JUST looking at GPU load (only goes upto 100%)

128105


but the memory and gpu clock rate make the gpu load % insignificant and hide smaller utilization changes that may help in diagnostics.

My ask is maybe the ability to remove fields (statistics) &/or have the graph reset scaling based on the min/max/avg of the data selected.
 
Joined
Jun 7, 2013
Messages
39 (0.01/day)
Location
Switzerland
OK, I think I understand your problem now: you want to switch back that only one category is shown (?).
I can tell you a trick to force that:
  1. Select „Number of files = 2“
  2. Select „Number of files = 1“
After that, only one category of your single logfile is shown again. Multiple categories of one logfile shown in one diagram is a „late introduced feature“ of my LogViewer so the handling is „a little bit tricky“ :)

Another (maybe better) UI solution could be instead of hiding the „+“ button in case of three categories are shown, to change it to a „-“ button. So, the number of categories go like:
1 -> 2 -> 3 -> 2 -> 1 -> 2 > 3 -> 2 -> 1 ...
 
Last edited:
Top